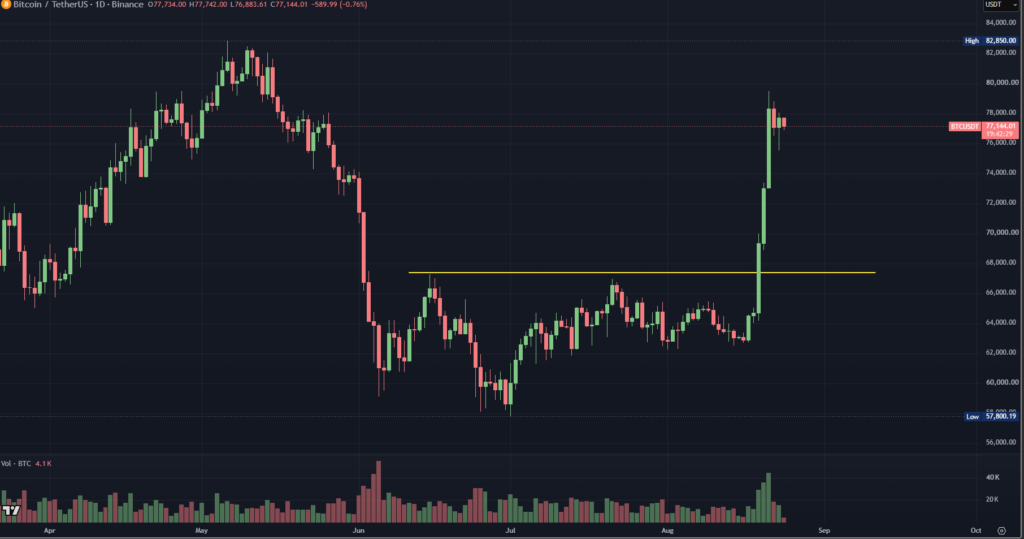
Bitcoin spent about two months trapped inside an unusually narrow band and finally cleared the 67.4K ceiling on a full body green breakout candle. The instant reflex after a fast recovery like this is to brace for the giveback, and that instinct is usually right about direction but often wrong about timing. Past rally starts on Bitcoin generally do not fold on the same day. They coast for weeks first, and it is that coast phase after the breakout that tends to trap traders who front run the reversal.
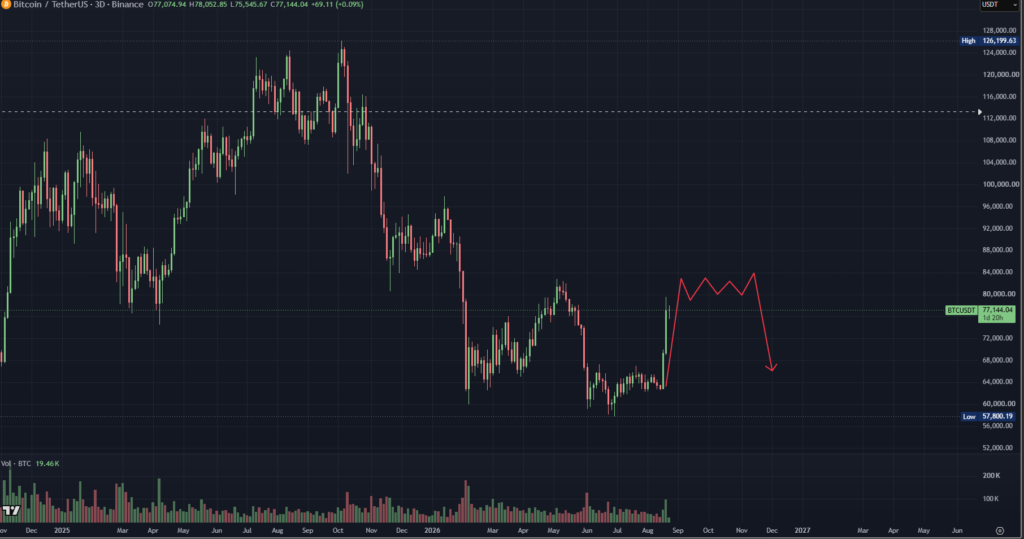
The rise coast fall shape not rise reverse
If we walk the last four rally legs on the 3 day view, starting from the trend low, the same rise coast fall shape keeps repeating. Price surges on a big candle, then it drifts sideways near the highs for roughly two months, and only then does the pullback arrive. It happened after the trend low. It happened again on the recovery leg that followed the same shape. The election candle behaved the same way. The most recent rally leg before this one did too. The pattern is not that Bitcoin peaks and reverses in one motion. The pattern is that the coast phase eats most of the calendar between the surge and the drop, so traders who front run that reversal generally give up their position too early to catch what actually comes after the surge.
This is a small four cycle sample of rally legs, and worth flagging as such. It is not a base rate that anyone can lean on for probability math. But the point here is not statistical. The point is that trader reflex tends to compress the rise coast fall shape into a rise reverse call, and the surge action following the recent breakout does not yet support that compression. The same reflex shows up in what the volume tape did on the breakout candle, which is the next thing to look at on this rally.
Volume as entry stamp, not exit stamp
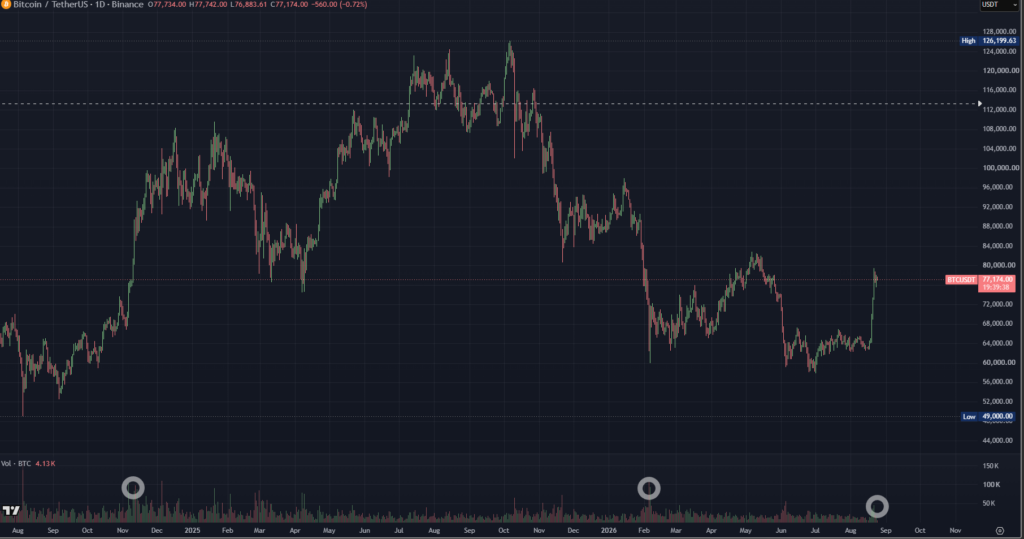
Every one of those four rally starts also shared a volume shape at the moment the reflex reversal failed to arrive. Big rally openings on Bitcoin have generally carried heavy volume alongside the first full body green candles. Volume in this reading is not a warning about exhaustion. It is a signature. It appears when the market crosses a decision line, and it stays elevated for the first few sessions after the surge fires. In the election move the elevated tape ran for more than two months before rolling over into the pullback. The recent breakout opened with a similar shape, one large candle followed by continuation, so on that metric the volume behavior does not look visibly different from prior rally starts on the same tape.
Moving averages are late but they finish
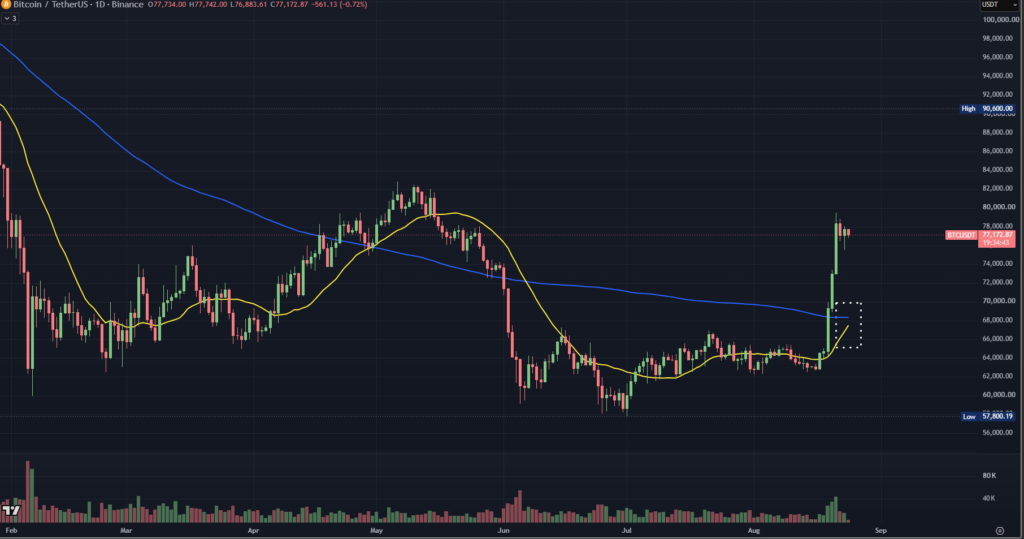
Volume tells us the breakout candle is a real signature. Moving averages tell us the trend has finally turned, and they tell us slowly. Three of them sit on the same daily plot as the volume subpanel, the 20 day(yellow) and the 120 day(blue). On the way down the shorter averages sit under the longer ones through the red candles. On the way up they roll over in reverse order until the shortest crosses above the longest, which is the so called golden cross. That crossing is famously slow because moving averages are lagging by construction. They can only confirm a move that already happened, so their signal generally arrives well after the easy part is over.
The relevant question is not whether the golden cross triggers now. It likely will if price holds for a few more sessions. The relevant question is what the same alignment did the last time it printed. In April the moving averages crossed and price broke down almost immediately, then chopped for months. That is the counter example every desk remembers, and it is also the reason the current break has less crowd faith than the pattern would otherwise justify.
Narrower the box, longer the follow through
The moving averages have another thing to say about the current move, this time through the range they compressed into. A two month band this tight is unusual on Bitcoin. Narrow ranges generally tend to feed larger moves once they finally break, roughly on the logic that stored volatility has to spend itself somewhere. That framing does not tell us the direction of the coming move. The break did. What the narrow box adds to the moving average read is a duration argument for what comes after the crossing. Boxes that took months to build generally do not resolve in a single day, and the tighter the compression the longer the tape after the break tends to run before the reversal has to arrive.
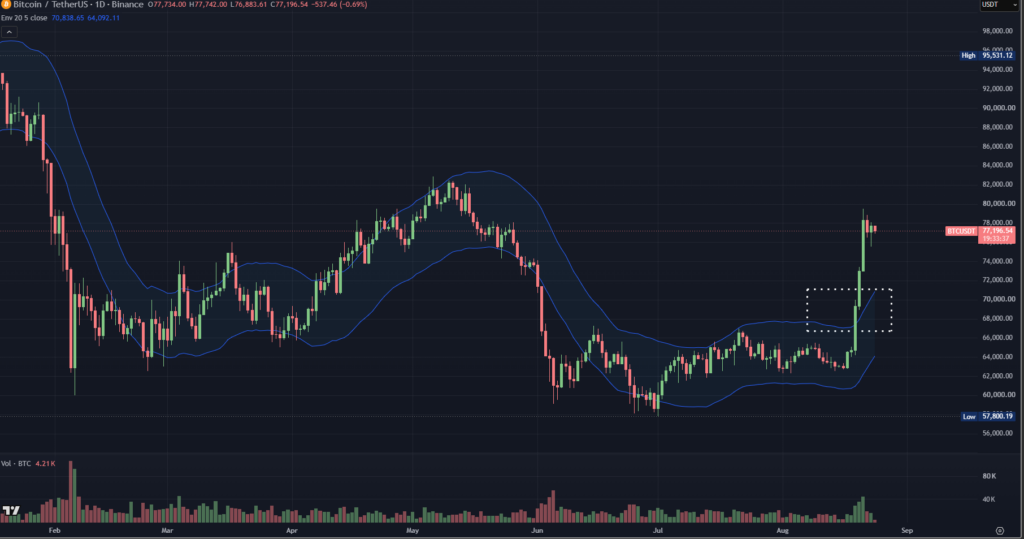
Envelope band studies tell that same narrow duration story from a different angle. When price closes above the top band after a long compression, the actual local high tends to arrive weeks or even months later, not on the breakout candle. The prior instances of that top band break we can check ranged from about two weeks to nearly three months between the break and the true local high on the tape. That envelope window is far too wide to time. It is narrow enough to argue against fading the first day of the break.
April is the counter example not the template
The envelope band check, like the moving average check, has to answer for April on the same chart. The single strongest reason to distrust the current setup is that April did exactly this narrow box breakout shape and failed. Price broke out of a similar tight band, the moving averages crossed, and the reversal came almost at once. That April memory is fresh, and it is the reason so many desks are hedging into strength on this recent break rather than adding to the position. Two identical failures in a row would be unusual on this pattern set, but unusual is not the same as impossible, and the four cycle sample here is small enough that we cannot rule that April repeat outcome out.
The read on the current chart is not a directional call in disguise. It is a claim about the rally calendar. If the past four rally legs are any April aside guide, the interesting question over the next month is not whether Bitcoin gives some of this recent break back. It probably will. The question is whether the giveback arrives before the coast phase gets to play out, or after. Even with that April counter example factored in, the base case for this rally, weak sample and all, still points to after the coast rather than during it.
Data & Sources
BTC price action from public spot charts around the recent breakout above prior resistance. Rise coast fall observation collected across four past rally legs since the last trend low on the same daily view. Moving average overlays and envelope band references drawn on the same candles. Small sample caveats apply to the current pattern read throughout.