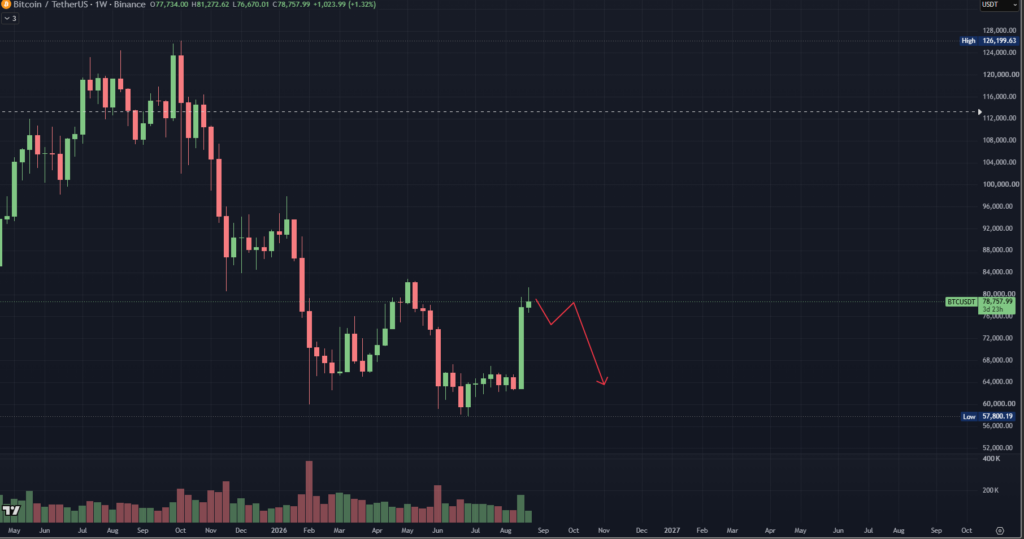
Bitcoin closed a run of large weekly candles that put the price well above where a popular bearish structure said it should sit. That structure, a weekly ending diagonal pointing at the mid-fifties, had been the preferred long-term read for months. It was not a wild call. It sat on defensible wave geometry and a slow bleed in weekly volume that argued for one more leg lower. The rally of the last few weeks likely broke the geometry that held it up. The interesting question is what a serious trader does when the structure they liked stops fitting the tape.
The ending diagonal setup and its 50K target
The ending diagonal is one of the tighter shapes in classical wave theory. Five internal legs, each overlapping the last, all fitting inside a narrowing wedge. It typically appears at the tail of a longer move, and it usually resolves in the opposite direction of the wedge, often with a sharp thrust once the pattern completes.
On the weekly frame for bitcoin, the count read the last few years as A up, B down, C up, D down, and pointed to a final E leg that could carry price into the mid-fifties around 50K before the pattern was complete. That target came from a rough measurement of the wedge floor and the prior swing lows that formed the pattern’s spine.
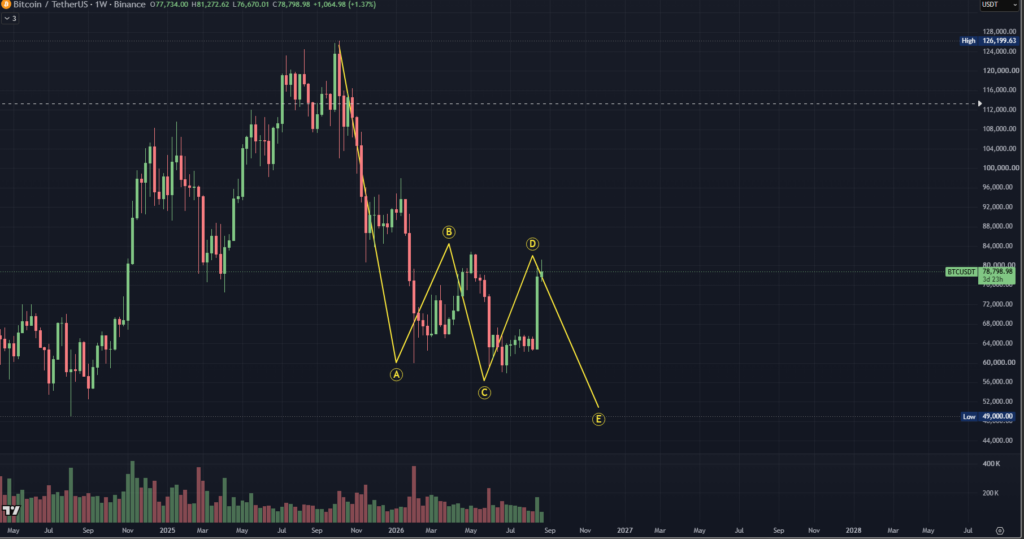
Two things gave that read weight. The internal wave sequence looked clean enough that several independent counts landed on similar labels. The pattern also predicted a fall that many readers considered plausible on macro grounds, so it slotted into a broader story about a delayed cycle low.
Where the D-wave breaks the geometry
A properly formed ending diagonal contracts as it develops. Each successive leg in the same direction is supposed to shrink. D should be smaller than B in absolute price terms. That contraction is what draws the wedge in the first place. If the later legs grow instead of shrink, the whole terminal-pattern reading breaks down.
The current move that would have been D has run up almost to the magnitude of the earlier B leg. That is not a diagonal anymore on a strict reading. It is a structure that started to fit and then outgrew the pattern that named it. The objective read is that this setup is done and the wedge is gone.
The volume tell that keeps a door open
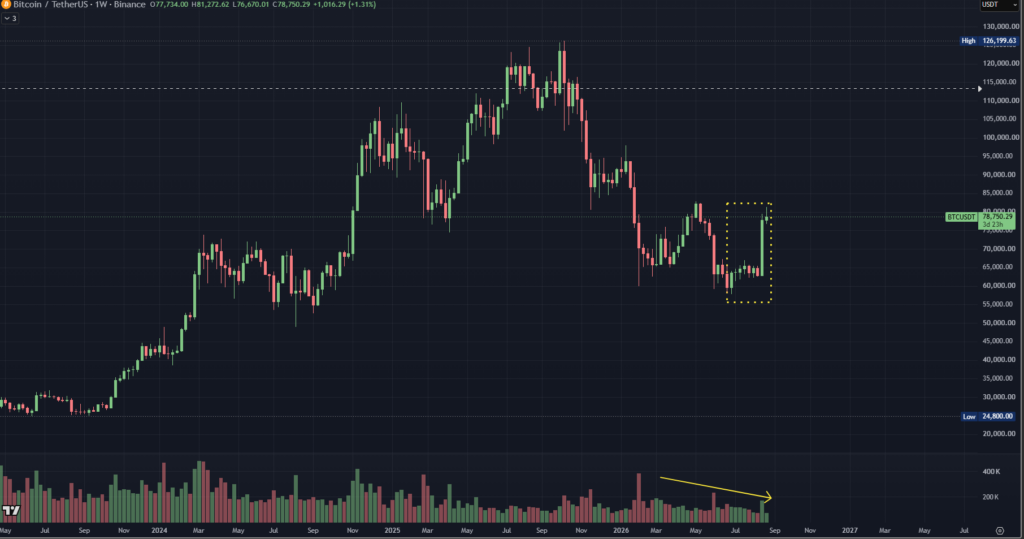
One piece of evidence argues against outright dismissal. Weekly turnover has been drifting down for months, and it kept drifting down through the recent burst of large green candles. Real trend reversals tend to arrive with participation. Money joins the move.
When price makes a decisive push higher and the volume bars do not join it, the follow-through often disappoints. That behavior does not confirm the diagonal, but it leaves room for a whipsaw scenario in which the recent rally gets faded and the pattern completes its E leg after all.
Two arguments, one for and one against, are enough to say the geometry is probably broken and possibly not. A disciplined reader gives both signals a seat at the table and lets price adjudicate the rest.
What a probability entry looks like in miniature
The clearest way to see how those futures translate into action is to look at a recent trade that ran the same playbook on a smaller frame.
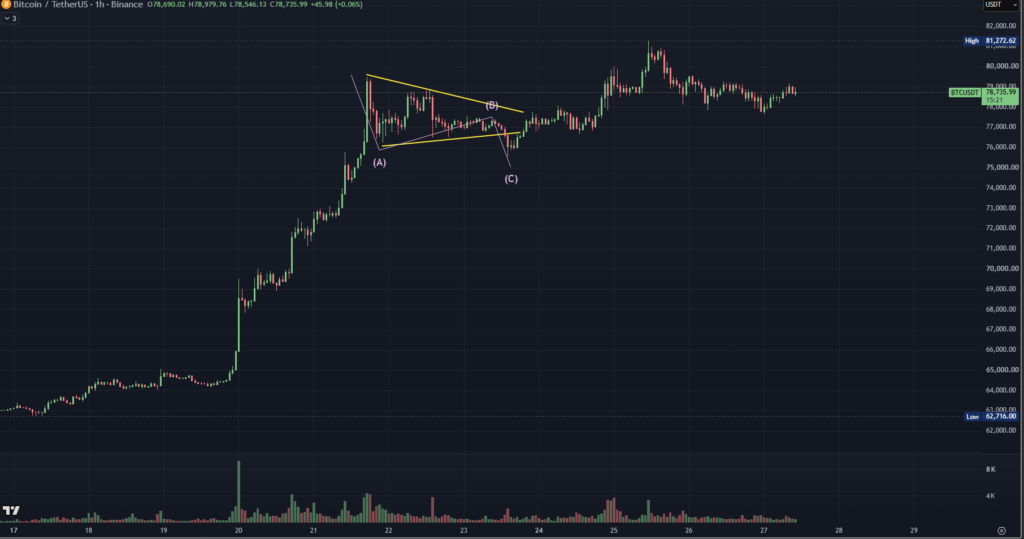
On the intraday frame not long ago, an A-B correction gave way to a small 1-2-3-4 triangle contraction, and a fifth-wave short entered on that setup and took profit into the drop that followed. Fourth waves often spend time as triangles, and that behavior turns them into a repeating setup for entries into the next leg down. That trade is the shape the discipline takes when it works.
The same reading fans out into three futures for the weekly frame, each with its own trade. The first is a time correction that eats into the recent gains without cracking them. A shallow A-B-C down, or a flat with a smaller internal count, would set up long entries into the pullback lows for anyone patient enough to wait.
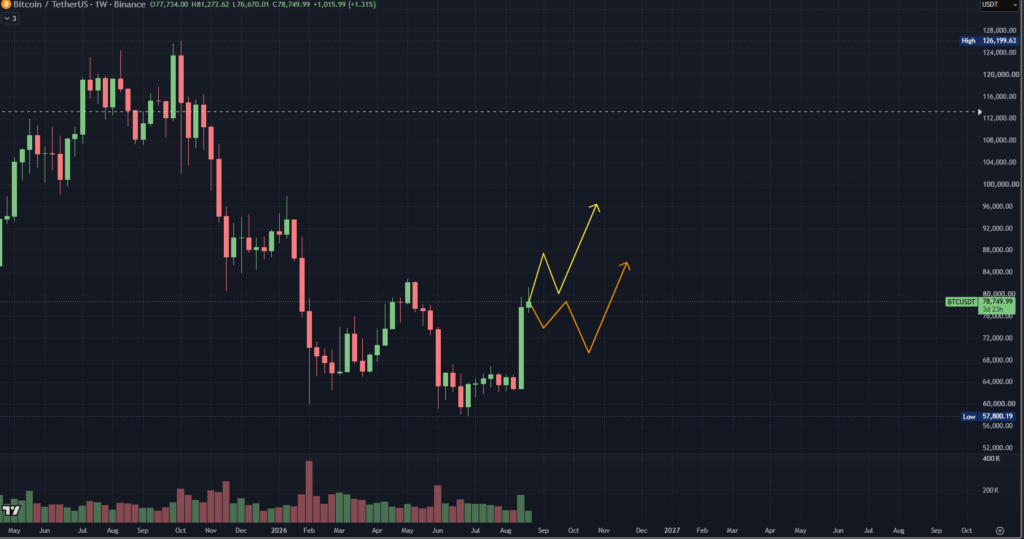
The second is a rally that keeps going without any meaningful correction. In that case the diagonal is fully invalidated and the read shifts to a broader impulse up. Chasing at these levels is generally the wrong choice. The play is to wait for a later pullback into a defensible level and enter long there instead of buying the top of a move that already ran.
The third is a sharp drop from current levels, the whipsaw the volume argument leaves room for. If price rejects hard and cuts through prior support, the diagonal survives and the E leg toward the mid-fifties returns to the table. The drop itself is tradable short on a proper break, and any exhaustion low near the mid-fifties might become the long entry patient buyers had been waiting for.
The rule that outlasts the pattern
None of these scenarios is worth trading blind. The discipline that separates a working trader from a stubborn analyst is treating one scenario as the primary bet and the others as adjustment plans. Sub-scenarios exist to tell a trader what to do when the main call was wrong. They do not earn their own separate entries.
Traders who fold tail cases into their entry rules often develop a habit of betting on the lowest-probability path over and over. The account gives back the wins between blowups. The same discipline covers the reflex to chase a big green candle after it has already printed. Entries belong at pullback zones, not at the top of a move that ran without you.
That is what this setup looks like from the seat of someone who cares about the account more than the call. The diagonal that pointed at the mid-fifties may still be alive. It may already be dead. Neither of those outcomes is a trade on its own. The trade is the plan for each door the tape can walk through, and the willingness to take the one the market opens rather than the one the analyst prefers. That patience is not glamorous. It is the difference between the trader who is still trading next year and the one who is not.
Data & Sources
BTC weekly and intraday chart structure read from public exchange feeds as of 2026-08-26. Elliott wave labeling is subjective, and different readers may draw slightly different counts on the same tape.